MachinesData brief
Median EPA range for new EVs climbed from 82 to 295 miles since 2012
EPA ratings for every US all-electric model year show the typical range, not just the headline best case.
Tec N Trend data desk · 1 min read · 2 open sources
- Median EPA range, MY2026
- 295 miles
- Middle half (p25–p75), MY2026
- 270–321 miles
- Median EPA range, MY2012
- 82 miles
- MY2026 configurations rated 308+ mi
- 118 of 321 (37%)
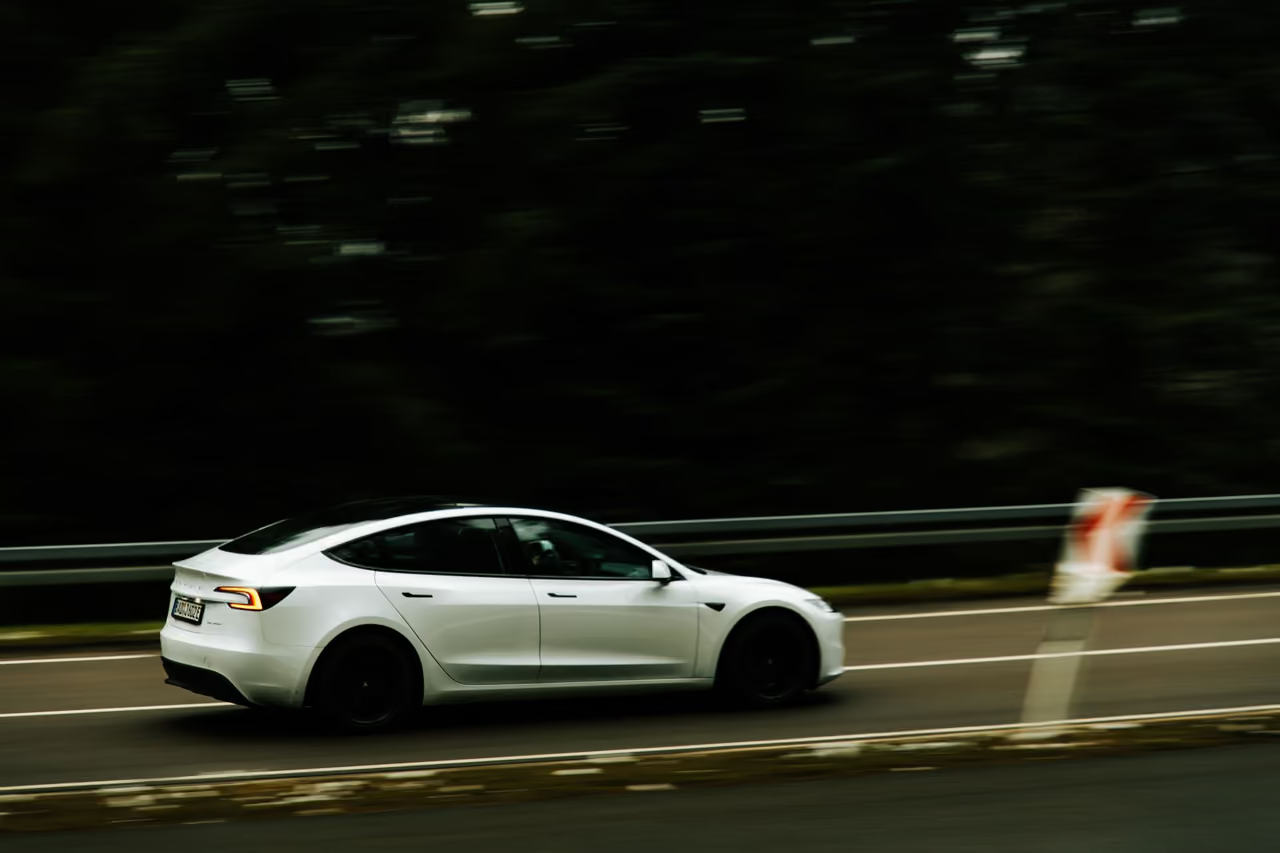
Hyundai has opened UK and European orders for the Ioniq 3 hatchback from about $25,000, and Electrek says the 61 kWh version is rated up to 308 miles on the WLTP test. That is a European rating, not an EPA one.
In the EPA database, the median rated range of all-electric configurations for model year 2026 is 295 miles, and the middle half of them sit between 270 and 321 miles. In 2012 the median was 82 miles. About 37% of 2026 configurations (118 of 321) are rated at 308 miles or more by the EPA.
So 308 miles is no longer unusual at the top end, but at roughly $25,000 it would be unusually cheap. WLTP numbers are generally more generous than EPA ones, so US buyers should wait for an EPA label.
Data, method and caveats
- US DOE / EPA fueleconomy.gov vehicles.csv (atvType = EV, field 'range') public domain (US government) · captured 2026-10-07
- Electrek on Hyundai Ioniq 3 UK launch news report, figures quoted not reproduced · captured 2026-10-07
- Each row in the EPA file is a vehicle configuration (trim, battery, drive), not a sales-weighted model, so the median describes the menu of options, not what people buy. Counts: 8 in 2012, 89 in 2022, 321 in 2026.
- Model year 2027 (171 configurations so far) is incomplete and excluded; the 2026 figures may still change as the EPA adds entries.
- The Ioniq 3 308 miles is a WLTP figure for the UK/EU version, shown only as a mark. It has no EPA rating and is not in the dataset. WLTP and EPA are different test cycles.
- Early years have few models (4 to 18 per year before 2016), so the band is wide and jumps in 2016 when longer-range cars arrived.
This brief as JSON or Markdown. Reuse the chart with credit to Tec N Trend and the sources above.