EnergyData brief
US solar capacity hit 228 GW by July 2026, nearly 7x its 2016 level
Six Flags' 12.37 MW carport is large for a carport but tiny next to the 34 GW the US added in 2025.
Tec N Trend data desk · 1 min read · 2 open sources
- US solar PV, July 2026 (EIA)
- 228.2 GW
- US solar PV, end of 2016
- 33.0 GW
- Added in 2025 (EIA)
- about 34.0 GW
- Six Flags carport (per Electrek)
- 12.37 MW
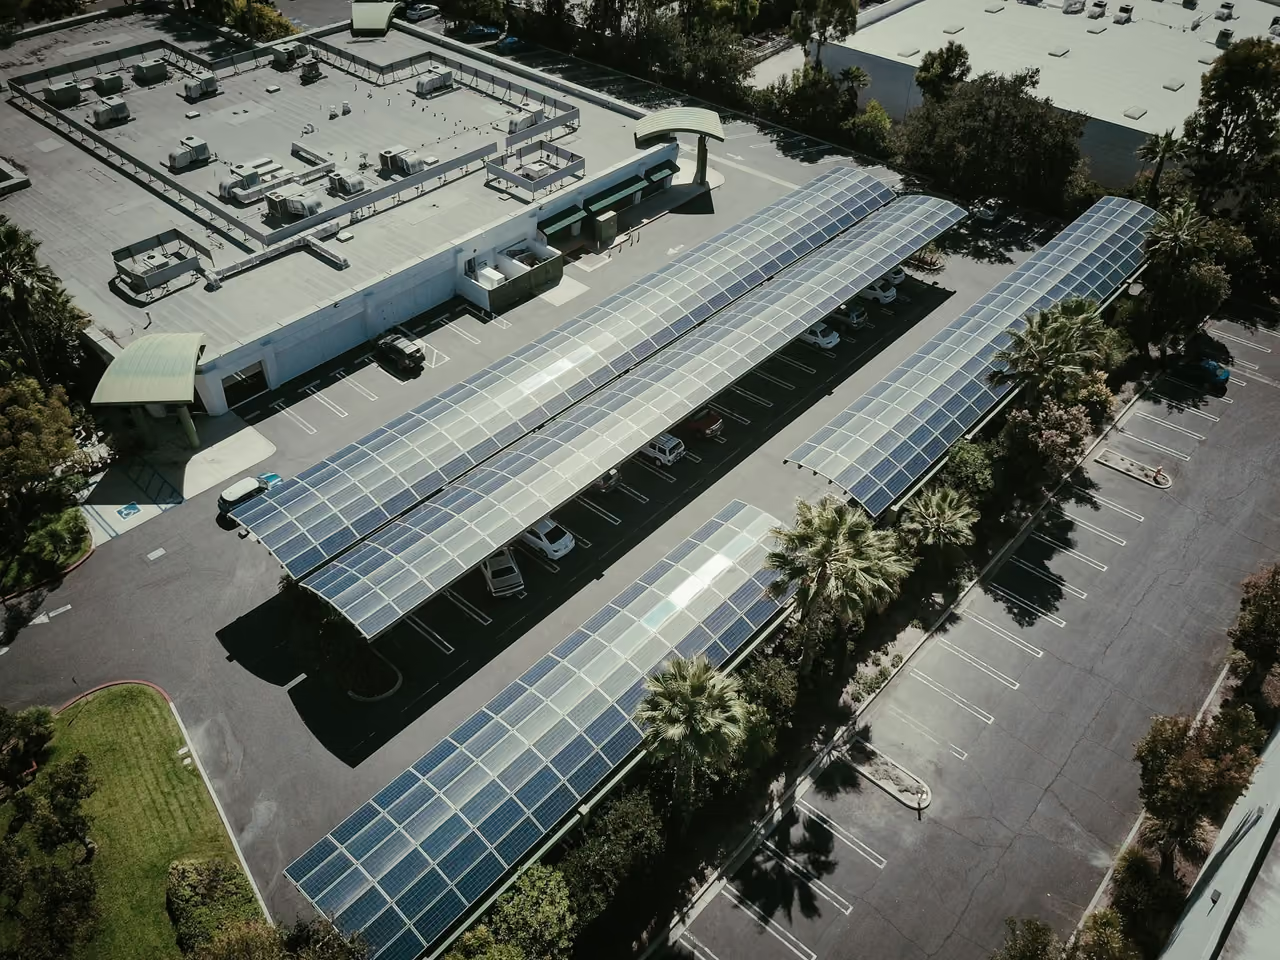
Electrek reports that Six Flags Magic Mountain has built a 12.37 MW solar carport over its parking lots in Valencia, California, with 22,908 panels, 109 EV charging connectors and a 2 MW / 8 MWh battery. Six Flags expects about 20.8 million kWh a year.
In EIA estimates, US solar capacity grew from 33.0 GW at the end of 2016 to 209.3 GW at the end of 2025, and 228.2 GW by July 2026. Utility-scale plants account for 165.3 GW of that and small-scale systems, mostly rooftops, for 62.8 GW. The US added about 34 GW in 2025 alone, so the carport equals roughly 1/2,750th of one year's additions.
Carports matter less for megawatts than for where the power lands: parking lots are already paved, close to demand and next to EV chargers.
Data, method and caveats
- EIA Electric Power Monthly, Table 6.1.A (data for July 2026, released 2026-09-24) public domain (US government) · captured 2026-10-07
- Electrek on Six Flags solar carport news report, figures quoted not reproduced · captured 2026-10-07
- Values are net summer capacity in AC megawatts, rounded here to 0.1 GW; 2025 and 2026 figures are preliminary per EIA. Year columns are end-of-year totals; the last column is end of July 2026.
- Small-scale solar (under 1 MW) is an EIA estimate from surveys EIA-861M and EIA-861, not a census.
- A 12.37 MW commercial carport is likely counted as utility-scale or small-scale depending on how it is reported; the EIA table does not identify individual projects. The 1/2,750 comparison is against capacity added, not a share of the fleet.
- Whether it is 'one of the largest' US carports rests on Six Flags' and Electrek's claim; no open dataset of carports was checked.
This brief as JSON or Markdown. Reuse the chart with credit to Tec N Trend and the sources above.