SpaceData brief
Arctic ice's 2026 low: 4.60 M km², 11th lowest in 48 years
Stack the minimum for every year since 1979 and 2026 sits in a crowded pack of recent lows, well above the 2012 record.
Tec N Trend data desk · 1 min read · 2 open sources
- 2026 minimum (5-day mean)
- 4.60 million km²
- 2012 record low
- 3.39 million km²
- 2026 rank (1 = lowest)
- 11 of 48 (NASA: tied 10th at 4.6)
- Avg minimum 1979-88 vs 2017-26
- 7.00 vs 4.45 million km² (36% lower)
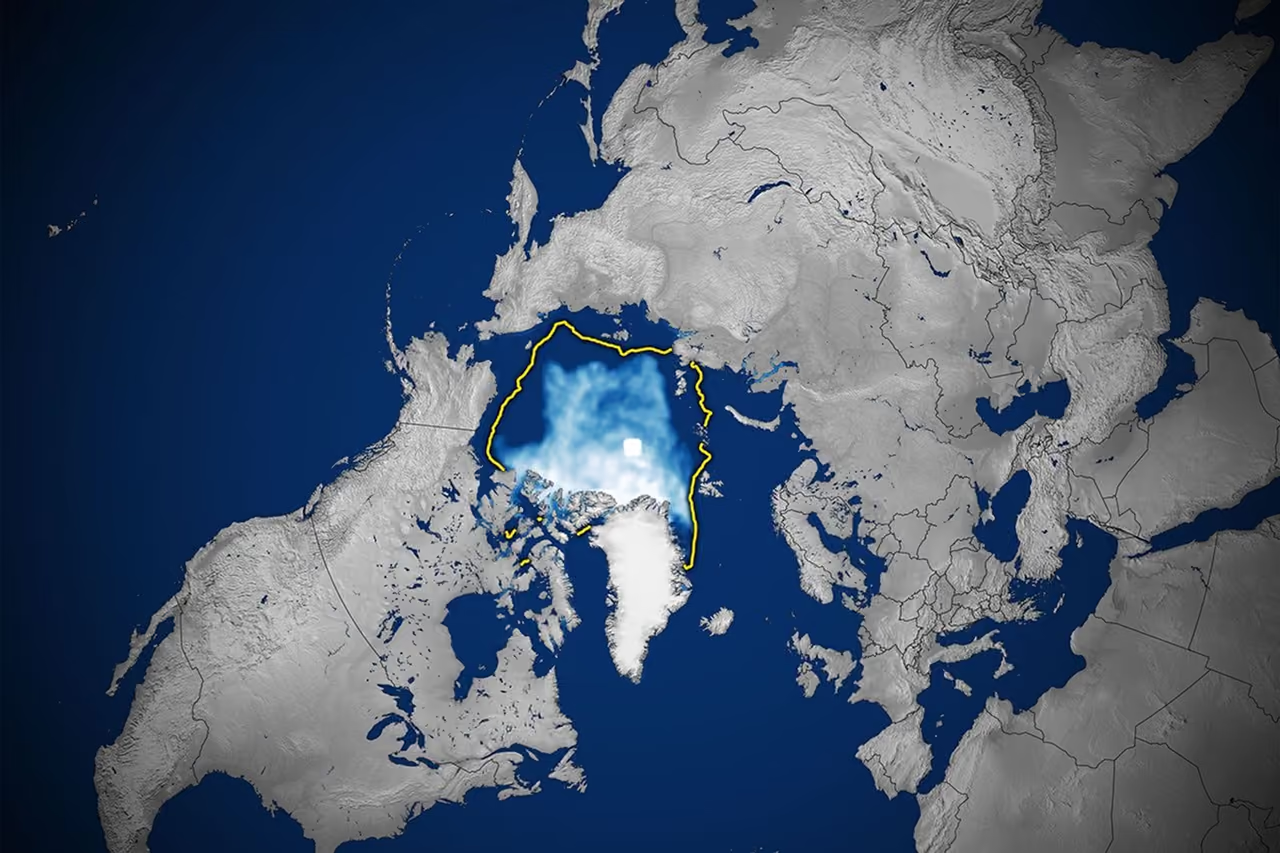
NASA's Earth Observatory reports that Arctic sea ice reached its yearly minimum on September 12, 2026, at about 4.6 million square kilometres. NASA says that ties three other years for 10th-lowest in the satellite record, and the freeze-up has now begun.
NSIDC's daily record, smoothed over five days, puts the 2026 minimum at 4.60 million km², against 3.39 in the record year of 2012. On that measure only 10 of 47 earlier years were lower, so 2026 ranks 11th, within a four-way cluster NASA rounds to the same figure. The 1979-1988 average minimum was 7.00; the 2017-2026 average is 4.45, a drop of 36%.
A single year's rank says little, since wind and summer weather can move the minimum by a few percent. The trend is what matters: all ten years that came in lower than 2026 are from 2007 onward, and no pre-2007 minimum dipped below 5.3. Watch the winter maximum next March for how much thick, multi-year ice remains.
Data, method and caveats
- NSIDC Sea Ice Index v4 daily extent (N_seaice_extent_daily_v4.0.csv) public domain (NSIDC/NOAA@NSIDC, free reuse with citation) · captured 2026-10-07
- NASA Earth Observatory: Arctic Sea Ice Shrinks to Its 2026 Minimum NASA public domain · captured 2026-10-07
- Our minimum is the lowest 5-day centred average of the daily extent (Aug-Oct) computed from the v4.0 daily file; NSIDC's own published minimums use a similar but not identical 5-day method, so third-decimal values can differ slightly.
- The 2026 value is preliminary: the last data in the file is 2026-10-05/06 and extent is rising, so the September minimum should stand, but NSIDC may revise it. NASA rounds 2026, 2025, 2010 and 2008 all to 4.6 million km2 (tied 10th); at full precision we get 11th.
- Before 1987 the satellite record has an observation only every other day, so the 5-day mean there uses fewer observations.
- Extent is the area with at least 15% ice concentration, not total ice volume.
This brief as JSON or Markdown. Reuse the chart with credit to Tec N Trend and the sources above.